How Policy Legacies are Shaping Local Governments’ Use of SLFRF Dollars for Community Violence Interventions
Section 1 & 2 Heading link
July 15, 2022
By Philip Rocco and Amanda Kass
Join our mailing list to stay updated about our research.
Testifying before a House Budget Committee hearing last month, Vince Williams—the Mayor of Union City, Georgia—put it bluntly. Without support from the State and Local Fiscal Recovery Funds (SLFRF) program, he said, “my city would have certainly continued to do as many communities have, and that is collapse.”
While state and local governments have only committed a fraction of their SLFRF aid to date, they have thus far focused their spending on replacing revenues lost as a result of the pandemic and to supporting existing programs and services. Yet as we have noted in our prior blog posts (here and here), the evidence suggests that cities and states have thus far committed fewer funds to new purposes. This includes Biden administration priorities like community violence interventions (CVIs), programs that identify those who are at the highest risk of experiencing violence and work to reduce violence through targeted interventions. One potential reason for this is the startup cost associated with spending on new policies or programs, especially those that lack a dedicated institutional support structure.1
State and Local Governments’ Use of Federal Dollars: How Capacity Matters
New federal grant programs have long served as catalysts for policy changes at the state and local level. Yet when intergovernmental programs give recipient governments substantial discretion over how to use grant dollars, policy innovations depend on more than federal dollars alone. Instead, their use of these highly discretionary aid hinges on the existing terrain of local institutions, policies, and political constituencies. When state or local governments spend money or create agencies to support a particular policy goal, they create a localized political constituency devoted to that goal. Not only might this constituency be able to mobilize around new federal grant opportunities, it may also constitute the organizational capacity to use those opportunities to implement new programs. This affects the allocation of new federal grant dollars. For example, states are more likely to leverage federal grant dollars for health policy innovations when they have greater bureaucratic capacity—more and better paid executive-branch staff—and more prior experience with federal programs.
Community violence interventions are one arena where pre-existing investments might shape governments’ ability to quickly take advantage of new opportunities afforded by federal grants, like the SLFRF. Pioneered in the 1990s, CVIs represent an evidence-based alternative to traditional policing. These interventions include, but are not limited to, “violence interruption” programs, which use credible community-based messengers to detect and interrupt potentially violent conflicts.
For the last few decades, these approaches to violence reduction have been pioneered by both nonprofit organizations as well as new city-level offices of violence prevention (OVPs), which coordinate and administer CVI programs and are typically housed outside of traditional public safety agencies.
Both community-based approaches to violence intervention and the city-level organizations meant to promote them have sometimes struggled to find durable institutional support at the city level.2 As the table below shows, of the 26 cities in our sample, 16 were doing at least some spending on CVI in 2019. Of these, 11 had a formal OVP in place to coordinate spending.
CVI Infrastructure Investments in Sample Cities as of 2019
| OVP in 2019 | No OVP in 2019 | |
|---|---|---|
| CVI Spending in 2019 | Baltimore, Boston, Chicago, Los Angeles, Milwaukee, Minneapolis, Oakland, Philadelphia, Pittsburgh, Portland, Stockton | Albuquerque, Baton Rouge, Denver, Memphis, Newark* |
| No CVI Spending in 2019 | Atlanta*, Austin*, Buffalo, Charlotte, Detroit, Jersey City, Phoenix, St. Louis, St. Paul*, Toledo |
section 3 Heading link
How Policy Legacies Shape CVI Spending
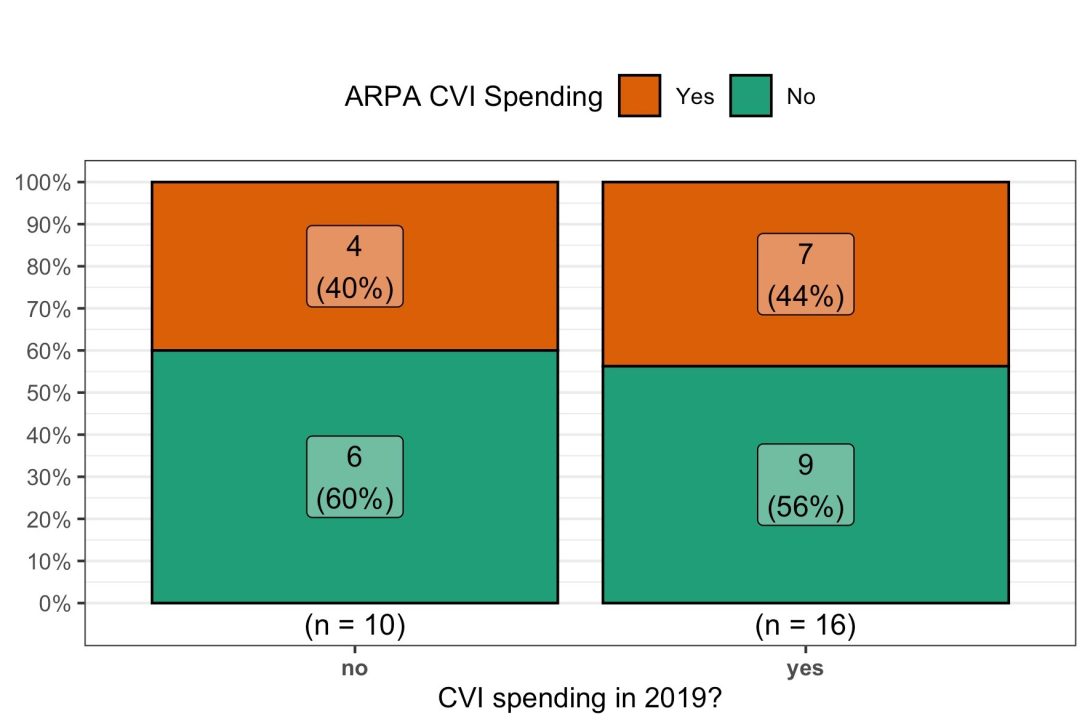
To begin, let’s look at whether cities with pre-existing investments in CVI are more likely to report CVI spending using SLFRF funds to the Treasury Department. The two plots below examine the percent of the 26 cities in our sample reporting any SLFRF spending on projects they deem as CVI to Treasury and are broken down by cities policy legacies.3 Figure 1 captures how cities that did and did not spend on CVI in 2019 are reporting to Treasury whether they used SLFRF dollars on CVI spending. Of the 10 cities that that did not do CVI spending in 2019, 4 (40%) reported obligating SLFRF (or “ARPA”) dollars towards CVI projects as of the end of 2021. By contrast, of the 16 cities that did spend on CVI in 2019, 7 (44%) reported obligating SLFRF dollars to these projects. This difference was not statistically significant, however.4
section 3 cont, fig 1 Heading link
Did OVPs matter for SLFRF CVI spending?
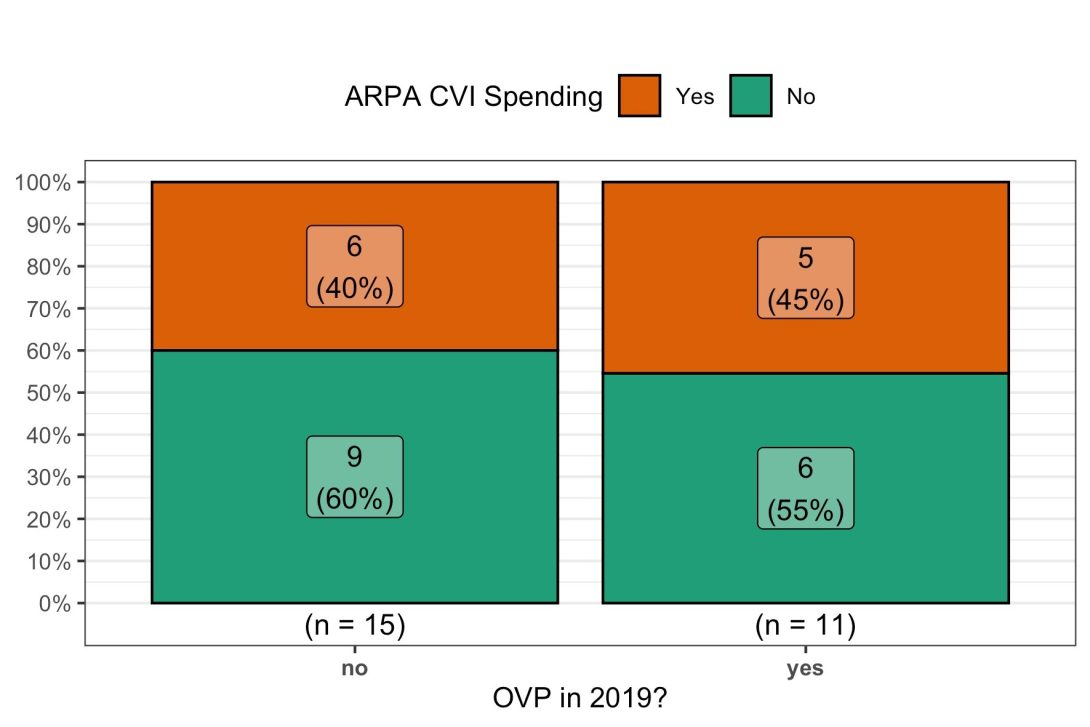
Figure 2 examines how cities with and without an OVP in 2019 are reporting CVI spending to Treasury. Here we see that cities with an OVP in 2019 were no more likely than other cities to report at least one CVI project to Treasury in their first report. While 45% of the sample cities that had an OVP in 2019 obligated SLFRF dollars towards CVI projects, a similar proportion of cities that lacked an OVP in 2019 did the same. As above, the difference was not statistically significant.5
section 3 cont, fig 2 Heading link
What about differences in the level of SLFRF funding cities are directly devoting to CVI projects?
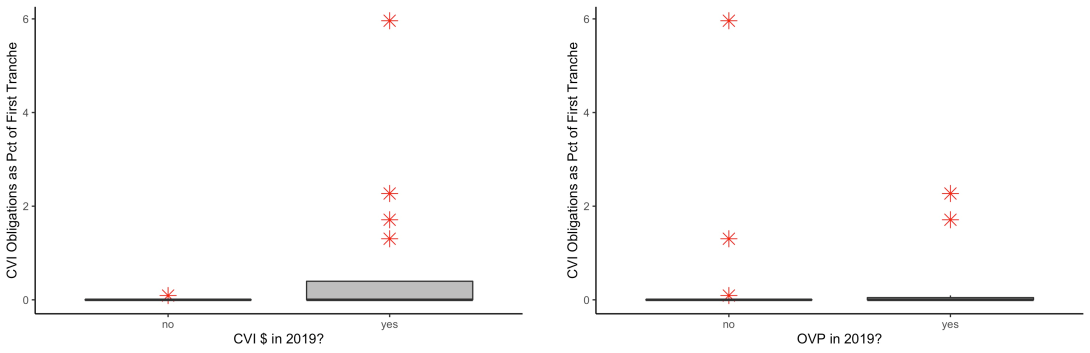
The boxplots in Figure 3 display variation in CVI obligations as a percentage of cities’ first tranche of SLFRF dollars. Cities that spent on CVI in 2019 obligated 0.7% of their first tranche SLFRF dollars to CVI projects, on average, while cities that had no pre-existing investments devoted an average of .009%. This difference is statistically significant, but just barely, and is likely being driven by an outlier.6 There was no statistical difference in SLFRF CVI obligations between cities that had and did not have an Office of Violence Prevention as of 2019.7
section 3, image 3 Heading link
If policy legacies do not appear to make much of a difference in whether cities are allocating SLFRF dollars to community violence interventions, it could reflect the broad patterns we noted in our second blog post: given administrative barriers to standing up new programs with SLFRF dollars, recipient governments devoted the largest share of their first tranche to revenue replacement.
Further, it is worth remembering that the reports governments submit to Treasury do not tell the whole story of how SLFRF dollars are impacting city budgets. Crucially, those reports fail to capture how SLFRF dollars may indirectly affect cities’ use of other revenue sources to support these types of projects. To examine this possibility, we collected data on current adopted budgets for all cities in our sample and noted whether these budgets included any support for CVI projects or programs—not just SLFRF spending.
section 3 Heading link
As the figures below show, pre-existing investments in CVI accounted for statistically significant differences in current budget allocations.
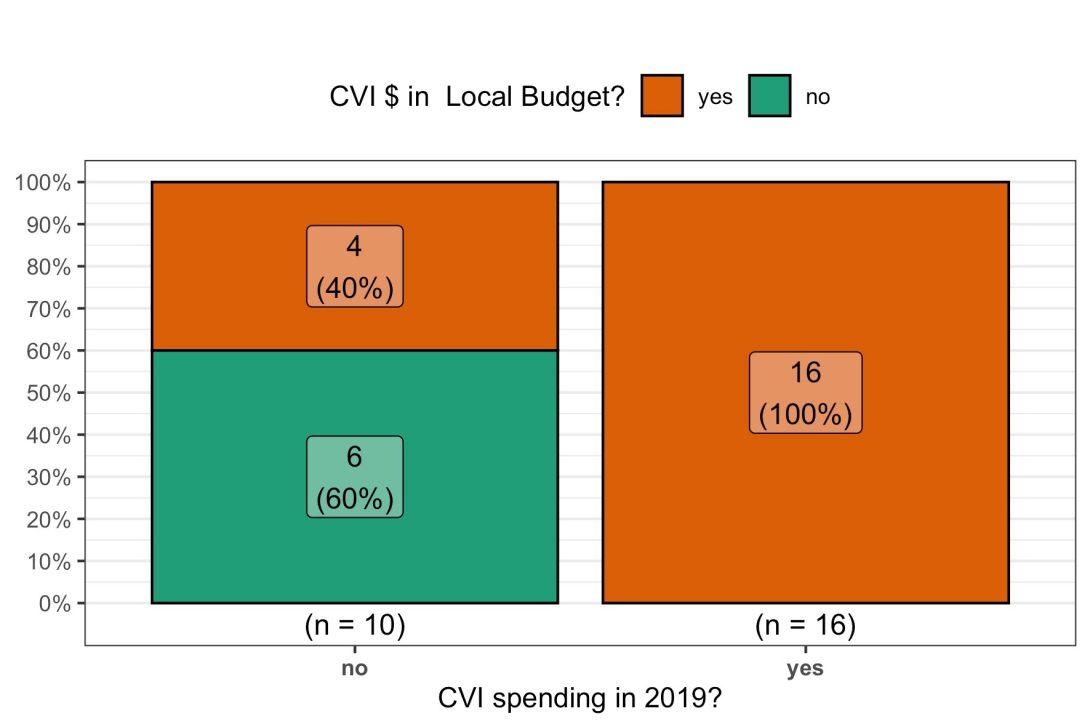
First, let’s examine how cities that did and did not spend on CVI in 2019 are spending on CVI in their current budgets. As Figure 4 shows, only 40% of cities that did not spend on CVI in 2019 are currently allocating at least some expenditures to CVI, 100% of cities that spent on CVI in 2019 are currently budgeting for these programs. The difference here is statistically significant.8
section 3, image 4 Heading link
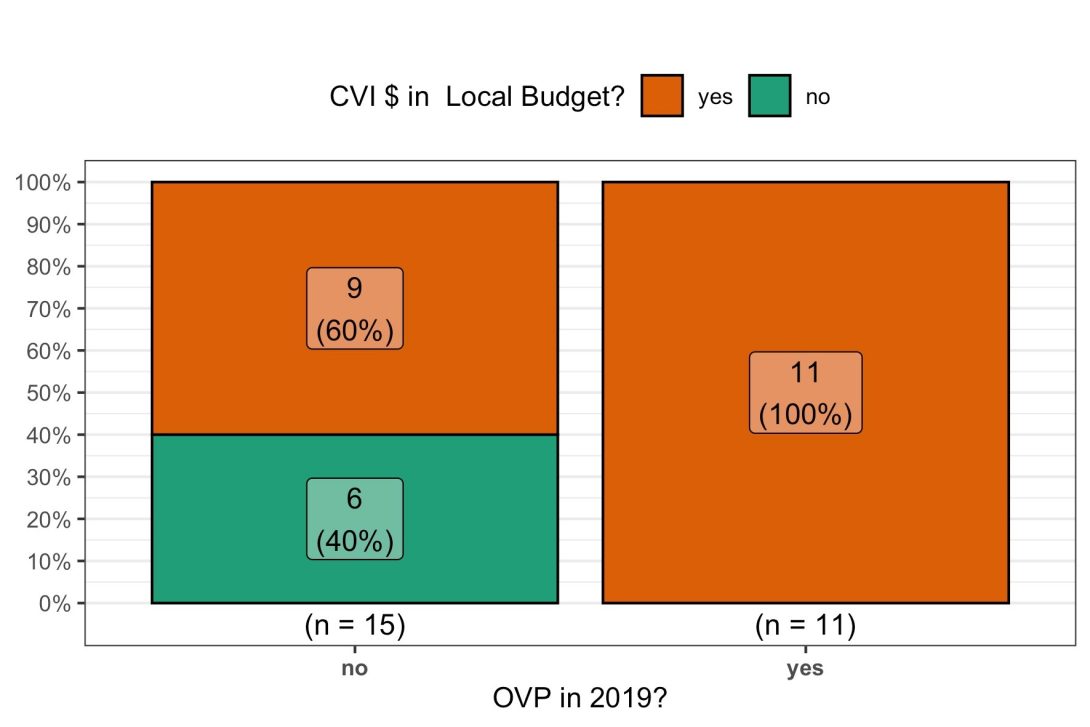
Now let’s examine how cities with and without an OVP in 2019 are spending on CVI in their current budget. As Figure 5 shows, while 60% of cities without an OVP in 2019 are spending on CVI in the current year, 100% of cities with pre-existing OVPs are currently spending on CVI projects or programs. The difference here is also statistically significant.9
Conclusion, figure 5 Heading link
In sum, our evidence suggests that cities which that funded CVI in 2019 and that had an OVP in 2019 are more likely to report CVI spending in their current budgets.
Conclusion
Our analysis suggests several preliminary conclusions about how cities are using SLFRF dollars to support community violence interventions.
First, even cities with stronger policy infrastructures to support CVI may face conflicting incentives when obligating the first portion of their SLFRF aid. Indeed, given the administrative burdens in setting up new programs, recipient governments across the board were far more likely to spend initial funding on revenue replacement than on new programs.
Second, a larger number of cities are spending on CVIs by drawing on multiple revenue sources other than SLFRF. This suggests that SLFRF’s effects on local CVI spending may be indirect, though our analysis does not yet allow us to determine whether this is the case. We will address this question further in a future blog post.
Third, when we look at local budgets rather than SLFRF Project and Expenditure Reports, we do see a link between policy legacies and current funding for CVI. And unsurprisingly, cities with stronger policy legacies on CVI—those that spent on CVI programs in the past and those that had already established an Office of Violence Prevention—are more likely to be allocating to these types of projects currently. This suggests that if SLFRF has an effect on local CVI funding it may not be even across cities.
In sum, when federal programs allow a high level of local discretion, a city’s pursuit of new local initiatives is contingent not on the new revenue alone, but on its institutional capacity to direct resources to that purpose.
Endnotes Heading link
Endnotes
1 We thank Molly Clark for her excellent research assistance on this post.
2 The predicament in which community-based interventions find themselves is a common one in the American policy landscape. While some policy interventions must clear an organizational “threshold” or “critical mass” point to allow for their initiation or subsequent success, the politics of legislative bargaining treat these programs as “divisible” or “piecemeal” public programs with “negotiated and specialized payoffs.” As such, some policies have threshold demands that simply will not be met in the standard process of legislative bargaining. See Paul Schulman, “Nonincremental policy making: Notes toward an alternative paradigm,” American Political Science Review 69, no. 4 (1975): 1354-1370.
3 All spending must be reported to Treasury at the project level, and governments must assign a Treasury created Expenditure Category (EC) to every project. To determine how many SLFRF dollars went to CVI programs, we counted any obligations that were assigned EC 3.16 as CVI spending. It’s important to note that for this stage of analysis we did not scrutinize the projects cities assigned to EC 3.16, and spending in that category may be mislabeled as CVI (a future blog post will address this concern directly). For more on Expenditure Categories, see our prior blog posts here, here, and here.
4 X2 = 0.00, p = 1
5 X2 = 0.00, p = 1
6 t = -1.77, p = 0.096
7 t = 0.26, p = 0.8
8 X2 = 9.33, p = 0.002
9 X2 = 3.69, p = 0.05