What the First Batch of Treasury Department Reports Tells Us About How Governments are Using Their ARPA Money
start Heading link
June 15, 2022
By Philip Rocco and Amanda Kass
Join our mailing list to stay updated about our research.
At the beginning of the COVID-19 pandemic, state and local governments were universally recognized as constituting the “front lines” in emergency response. The federal government, to extend the metaphor, provided reinforcements—the most important of which was fiscal support.
So how are the reinforcements helping at the front lines?
Earlier this month, the Treasury Department released data which offers a first glimpse at how state, local, tribal, and territorial governments are spending the $350 billion Congress allocated to them as part of the Coronavirus State and Local Fiscal Recovery Funds Program (SLFRF), a significant component of the American Rescue Plan Act.
While the data release only covers a limited range of jurisdictions (1,756 out of 40,000+) and does not reflect decisions made in 2022, it suggests that states and large cities have thus far spent a small percentage of their available funds, and have devoted the bulk of their spending activity to replacing lost revenues, replenishing Unemployment Insurance trust funds, and making investments in public health. By contrast–there has been far less direct spending of SLFRF money on some policy priorities articulated by the Biden administration earlier in the year, including in the area of community violence intervention (CVI).
In this blog post, we provide an overview of the broad spending patterns revealed by the Treasury data (the data is available as an excel here, under the “PUBLIC REPORTING” section).
What the Treasury Data Tells Us, and What It Can’t
As we noted in our inaugural blog post, analyzing national data on SLFRF requires extreme caution. So a few important caveats are in order before proceeding to our analysis.
First, because of the Treasury Department’s tiered reporting structure, the spending data we currently have from the first batch of Project and Expenditure Reports only reflect the activities of 1,756 governments—including all states, U.S. territories, and many (but not all) large metropolitan cities and counties.1 Hence it is impossible to make claims about smaller jurisdictions’ spending patterns based on this data.
Second, while the data only reflect spending activity between March and December 31, 2021, the Treasury Department did not finalize its program rules until 2022. Hence it will perhaps be more illuminating to re-examine spending data released for the second quarter of this year. This is because governments may have been hesitant to spend before the rules were finalized or changed their plans based on the finalized rules.
Third, the data only capture how recipient governments are spending SLFRF dollars. They do not capture how these governments have altered their use of other sources of revenue, including own-source revenue and revenue from other grant programs, in response to receiving the SLFRF aid. That is to say that these data do not capture the indirect effects of SLFRF on state and local spending.2
Finally, data submitted to the Treasury Department captures three types of spending information:
- Planned spending, which is the approved budget for a project (for the definition of ‘project’ see our first blog post), but is not what has actually been spent.
- Expenditures, which captures spending that has taken place.
- Obligations, which is similar to expenditures, but is more expansive because it also captures orders placed for property, services, contracts and/or subawards made (as well as similar transactions that require payment).
Planned spending can change and represents what governments intend to spend money on in the future, whereas obligations and expenditures capture what governments have actually spent money on to date.
For this blog post we relied primarily on obligations data because it captures how governments have actually used SLFRF money (as of December 31, 2021), and obligations captures expenditures. For example, the City of Oakland is using all of its $188 million SLFRF aid on revenue replacement. In the dataset released by Treasury, Oakland recorded the entire $188 million as obligated and reported its total expenditures to date as $76.5 million—hence the $76.5 million expenditures is counted in the $188 million obligation figure.
With those caveats out of the way, what does the first batch of Treasury data tell us about spending?
National Trends in the Obligation of SLFRF Dollars
In total, 1,756 governments provided P&E reports to Treasury. That includes the fifty states, three territories, as well as 1,703 metropolitan cities and counties. These 1,756 governments obligated just over $58 billion in SLFRF aid. The SLFRF aid is delivered to governments in two tranches, and the first tranche of money these governments received was close to $208 billion. So by the end of 2021, these governments had obligated 28% of the SLFRF aid they had available to spend.
| Unit of Government | Number of Reporting Governments | First Tranche of SLFRF Aid Transferred to Governments | Total Amount of Obligated Funds (as of December 31, 2021) | Obligated Funds as Share of First Tranche of Aid |
|---|---|---|---|---|
| Local Governments (Counties and Cities) | 1,703 | $48,940,176,026 | $16,292,656,767 | 33% |
| States | 50 | $155,239,591,954 | $41,383,820,979 | 27% |
| Territorial Governments | 3 | $3,474,875,194 | $514,535,010 | 15% |
| All Reporting | 1,756 | $207,654,643,174 | $58,191,012,756 | 28% |
above figures Heading link
The figures below provide an illustration of this overall distribution for state and local governments. State government SLFRF obligations ranged from 0% to 94% of the first tranche of funds.
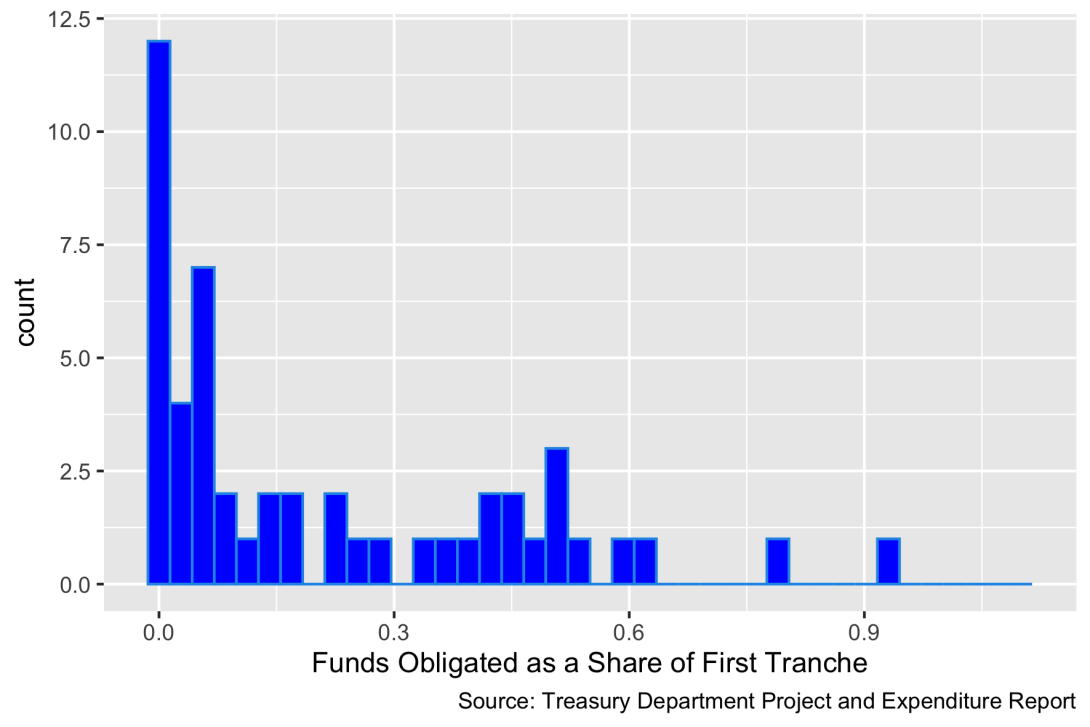
While the median state had obligated 9% of the first tranche of funds as of the end of 2021, 26 states had obligated less than 10%. Of these, nine states—including North Carolina, Rhode Island, and New York—were still reporting no obligations. By contrast, three states—Pennsylvania, Hawaii and North Dakota—reported they had obligated 60% or more of their first tranche of funds.
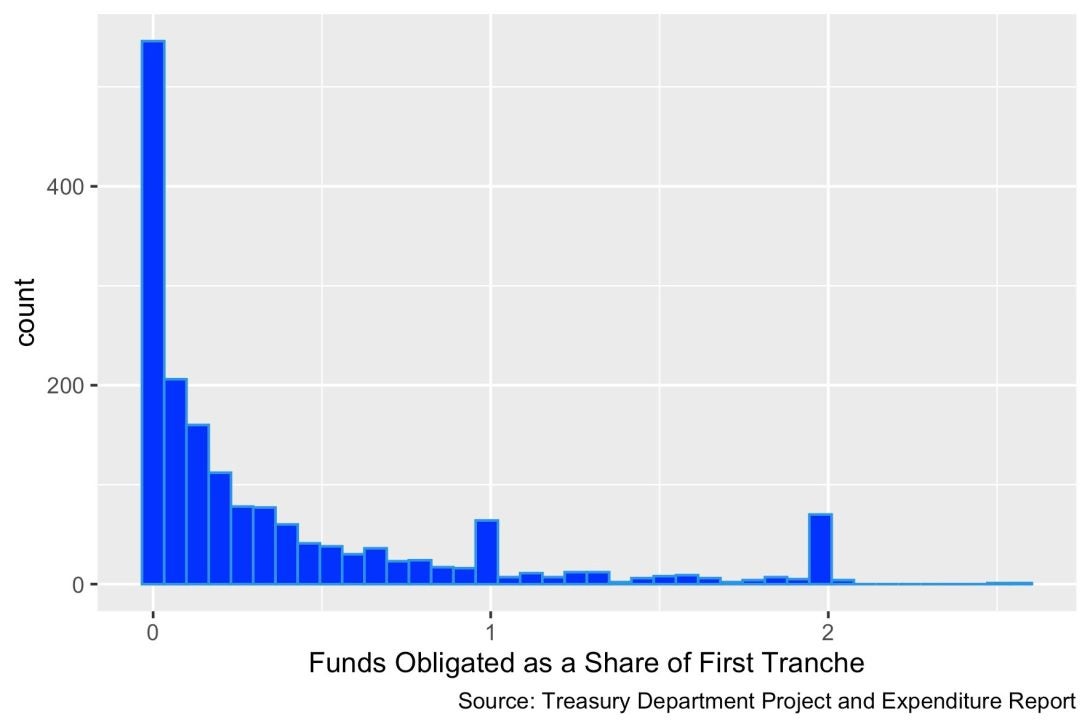
Where local governments are concerned, the pattern was similarly varied, as the figure to the right suggests.3 764 local governments reported obligating 10% or less of their first tranche of funds. Of these, 326 reported having obligated no funds whatsoever. By contrast, 29 units of local government actually reported having obligated the entirety of their first tranche. 186 units of local government reported having obligated more than 100% of their first tranche. This may indicate that some recipient governments have developed spending plans for their entire SLFRF allocation, rather than planning spending as they receive funds from the Treasury Department.
The large number of governments reporting no obligations does not indicate an absence of need. There are at least two more plausible explanations of this phenomenon. First, as our recent State and Local Government Review article points out, Treasury did not finalize its SLFRF program rules until January 2022 (the final rules went into effect on April 1, 2022). Governments may have been hesitant to obligate funds until numerous important regulatory issues had been settled and revised guidance documents had been issued. As one county government reported to Treasury, its officials were “concerned that the Interim Final Rules would change regarding the use of funds” and as such the county was “reluctant to identify projects or expend funds until we had a better understanding of the program requirements.”4
Second, even where governments have not obligated dollars, they have nevertheless indicated to the Treasury the existence of planned spending. For example, governments have reported adopted (but unobligated) project budgets. The total amount of funds in state and local governments adopted budgets is close to $106 billion, nearly double the amount of obligated funds (as of December 31, 2022).
By December 2021, most governments had adopted some spending plans. Only seven states reported having no obligations and no planned projects. In several cases, this was because the state legislature had not yet provided the authority for the state to make expenditures. In another case, it was because the state budget had passed in November, but the state’s Office of State Budget and Management had not yet certified the budget, which was required prior to the finalization of projects.5 Similarly, while 326 cities reported obligating no funds, a smaller number (231) reported no projects (indicating they had not adopted any spending plans). The reasons recipient governments provided for this were largely similar to those of states, citing—among other things—continued legislative deliberation, the challenges of developing a public-input process, as well as turnover in office, had delayed the creation of projects.
We get a further sense of the process for spending SLFRF dollars by looking at how state and local governments classify their obligated funds and projects.6 When we break down the data by expenditure category groups, we see that for local and state governments revenue replacement accounts for the largest or second largest share of obligated dollars, respectively. Given that revenue replacement is arguably the least administratively burdensome approach to spending SLFRF dollars—for example, it does not require the creation of new projects, the signing of new contracts or subawards—it makes sense that revenue replacement occupies a large share of early state and local obligations.
A large share of states’ obligated funds were in the “Negative Economic Impacts” category, which includes contributions to Unemployment Insurance trust funds, as well as providing direct to support to households and small businesses through.
| Expenditure Category Group Number and Name | State--Obligations ($ Billions) | State--% of Total | Local--Obligations ($ Billions) | Local--% of Total |
|---|---|---|---|---|
| 1-Public Health | $1.40 | 3.38% | $2.70 | 16.66% |
| 2-Negative Economic Impacts | $20.20 | 48.73% | $2.20 | 13.44% |
| 3-Disproportionately Impacted Communities | $1 | 2.50% | $0.90 | 5.68% |
| 4-Premium Pay | $0.30 | 0.62% | $0.90 | 5.73% |
| 5-Infrastructure | $1.90 | 4.70% | $1.30 | 8.12% |
| 6-Revenue Replacement | $16.30 | 39.32% | $7.90 | 48.23% |
| 7-Administrative and Other | $0.30 | 0.76% | $0.30 | 2.13% |
Breaking down the data further to the level of individual expenditure categories (rather than aggregate groups) reveals a similar pattern. Here, we can see that the largest share of state government obligations went to contributions to Unemployment Insurance trust funds (which is part of the Negative Economic Impacts group). For local governments, the largest share went to revenue replacement and the next largest share went to premium pay for public sector employees. In all of these cases, the obligation of SLFRF dollars was likely less administratively burdensome when compared to spending money on new programs.
Tables 3 and 4 Heading link
(a) Top 10 Expenditure Categories for State Governments
| Expenditure Category Number and Name | Obligations ($B) | % Total |
|---|---|---|
| 6.1-Revenue Replacement and Provision of Government Services | $16.3 | 39.32% |
| 2.8-Contributions to UI Trust Funds | $14.6 | 35.24% |
| 2.9-Small Business Economic Assistance (General) | $2.0 | 4.84% |
| 5.17-Broadband: Other projects | $1.7 | 4.15% |
| 2.12-Aid to Other Impacted Industries | $0.7 | 1.69% |
| 2.2-Household Assistance: Rent Mortgage and Utility Aid | $0.6 | 1.52% |
| 2.13-Other Economic Support | $0.6 | 1.43% |
| 2.6-Unemployment Benefits or Cash Assistance to Unemployed Workers | $0.57 | 1.39% |
| 2.11-Aid to Tourism Travel or Hospitality | $0.39 | 0.95% |
| 2.3-Household Assistance: Cash Transfers | $0.35 | 0.85% |
(b) Top 10 Expenditure Categories for Local Governments
| Expenditure Category Number and Name | Obligations ($B) | % Total |
|---|---|---|
| 6.1-Revenue Replacement and Provision of Government Services | $7.90 | 48.23% |
| 4.1-Public Sector Employees | $0.92 | 5.67% |
| 2.9-Small Business Economic Assistance (General) | $0.62 | 3.82% |
| 1.9-Payroll Costs for Public Health Safety and Other Public Sector Staff Resp | $0.57 | 3.53% |
| 1.7-Capital Investments or Physical Plant Changes to Public Facilities that respond to the COVID-19 public health emergency | $0.56 | 3.41% |
| 1.8-Other COVID-19 Public Health Expenses (including Communications Enforcement) | $0.43 | 2.63% |
| 7.1-Administrative Expenses | $0.31 | 1.90% |
| 5.1-Clean Water: Centralized wastewater treatment | $0.27 | 1.69% |
| 2.11-Aid to Tourism Travel or Hospitality | $0.26 | 1.60% |
| 3.11-Housing Support: Services for Unhoused persons | $0.26 | 1.59% |
Consistent with the findings above, Treasury data reveal comparatively fewer dollars obligated to other types of allowable uses under SLFRF. This includes uses that have been emphasized by the Biden administration. One example here is community violence interventions (CVI) programs which identify those who are at the highest risk of experiencing violence and work to reduce violence through targeted interventions.
In June of 2021, the Biden administration announced the Community Violence Intervention Collaborative (CVIC), a cohort of cities committed to scaling “evidence-based community-led strategies to reduce gun violence and enhance public safety.” In a speech that month, President Biden framed gun violence as a pressing public health issue, one that had worsened during COVID, and as such, cities were empowered and encouraged to use SLFRF dollars to address that issue and invest in community violence interventions.
We identified CVI projects using the Treasury Department’s expenditure categories. In the first set of data released by Treasury, governments provided information for 13,051 projects. With the March-December 2021 data the CVI expenditure category is “3.16-Social Determinants of Health: Community Violence Interventions.” It is important to note that it is up to governments themselves to assign an expenditure category to projects. And projects can only be assigned one expenditure category. For this post, we have not evaluated whether projects coded as expenditure category 3.16 are truly community violence interventions, but we will do this type of analysis in our future work.
As of December 31, 2021, nine states and 79 local governments have reported adopting at least one CVI project to the Treasury Department. Collectively, this represents 168 projects in total. As the table below shows, CVI-related projects accounted for $79 million in combined state and local obligations, around one-tenth of a percent of state and local governments’ total obligations (around $58 billion).7 Nevertheless, when we look at the adopted budgets state and local governments have reported to Treasury for these programs—which include funds not yet obligated—we find that the total figure is much higher, roughly $470 million.8 Note that it could also be the case that a larger number of governments are providing more funding to CVI indirectly as a result of SLFRF. We will explore this possibility, along with the details of CVI projects reported to Treasury, in a future blog post.
| Total Obligations (All Categories), $M | Total CVI Obligations, $M | CVI Obligations as Share of Total Obligations | Total Adopted CVI Budgets, $M | |
|---|---|---|---|---|
| State | $41,383 | $18 | 0.04% | $196 |
| Local | $16,292 | $61 | 0.37% | $274 |
| All | $58,191 | $79 | 0.14% | $470 |
Some Preliminary Takeaways Heading link
Some Preliminary Takeaways
To sum up, the evidence on how state and local governments are using SLFRF thus far points to four major patterns.
First, while there is wide variation in how state and local governments are using SLFRF dollars thus far, the data Treasury has collected suggests that the 1,756 governments included in this first release of spending data have obligated a little more than a quarter of the funds they had available to spend (the first tranche of funds transferred to governments).
Second, this lag reflects not only the fact that state and local governments were hesitant to obligate funds before Treasury finalized program regulations, but also the vagaries of the legislative process, as well as administrative burdens associated with getting funds out the door.
Third, and perhaps understandably, reported obligations tend to be concentrated in areas such as revenue replacement that have comparatively low levels of administrative burden (including premium pay for public employees and, for states, deposits in Unemployment Insurance trust funds).
Fourth, standing up new programs—including Biden administration priorities such as CVI—has taken longer. While nine state and 79 local governments have thus far reported 168 CVI projects to Treasury, adopting budgets totaling $470 million for these programs, only $79 million was obligated as of December 31, 2021.
In sum, while in quantitative terms the SLFRF represents a once-in-a-generation investment in state and local government, the funds alone do not appear to have solved the decision making or implementation challenges that make using resources difficult, especially where novel policy interventions are concerned.
Endnotes Heading link
Endnotes
1 This includes cities and counties that either have a population that 250,000 residents or received more than $10 million in CSLFRF aid.
2 Richard P. Nathan, Allen D. Manvel, and Susannah E. Calkins, Monitoring Revenue Sharing (Washington, DC: The Brookings Institution, 1975).
3 The histogram for local obligations as a percent of the first tranche does not include the City of Hesperia, California, which is currently reporting having obligated 13 times the amount of funds contained in its first tranche (total obligations reported as $157 million, while Treasury reports the first tranche of aid transferred to the city was just $12 million). We suspect that this is a typographical error. However, for the sake of consistency with Treasury’s reporting, we do not drop the city from our aggregate analyses.
4 Grand Traverse County, Michigan, Project and Expenditure Report. SLT Application ID: SLT-4273.
5 North Carolina, Project and Expenditure Report. SLT Application ID: SLT-0541.
6 For a quick guide to the allowable uses for SLFRF funds and the classification scheme itself, see our inaugural blog post.
7 The median CVI obligation level across these jurisdictions was $21,431.
8 The median adopted CVI project budget across all jurisdictions was $675,000.