A Close Up on State and Local Fiscal Recovery Funds Spending in Our 26 Sample Cities
Paragraph 1 Heading link
July 6, 2022
By Amanda Kass and Philip Rocco
Join our mailing list to stay updated about our research.
In our last blog post, we examined the latest Treasury Department data on how state and local governments are spending the $350 billion Congress allocated to them as part of the Coronavirus State and Local Fiscal Recovery Funds Program (SLFRF), an important component of the American Rescue Plan Act.
One of the major findings of our analysis was that state and local spending tends to be concentrated in areas such as revenue replacement, as well as in several other expenditure categories that have comparatively low levels of administrative burden. By contrast, standing up new programs—including Biden administration priorities such as Community Violence Interventions (CVIs)—has taken longer. CVI programs aim at preventing and disrupting cycles of violence and retaliation. This includes programs like the “Cure Violence” model of violence interruption and hospital-based interventions designed to identify and reduce risk factors for violence.
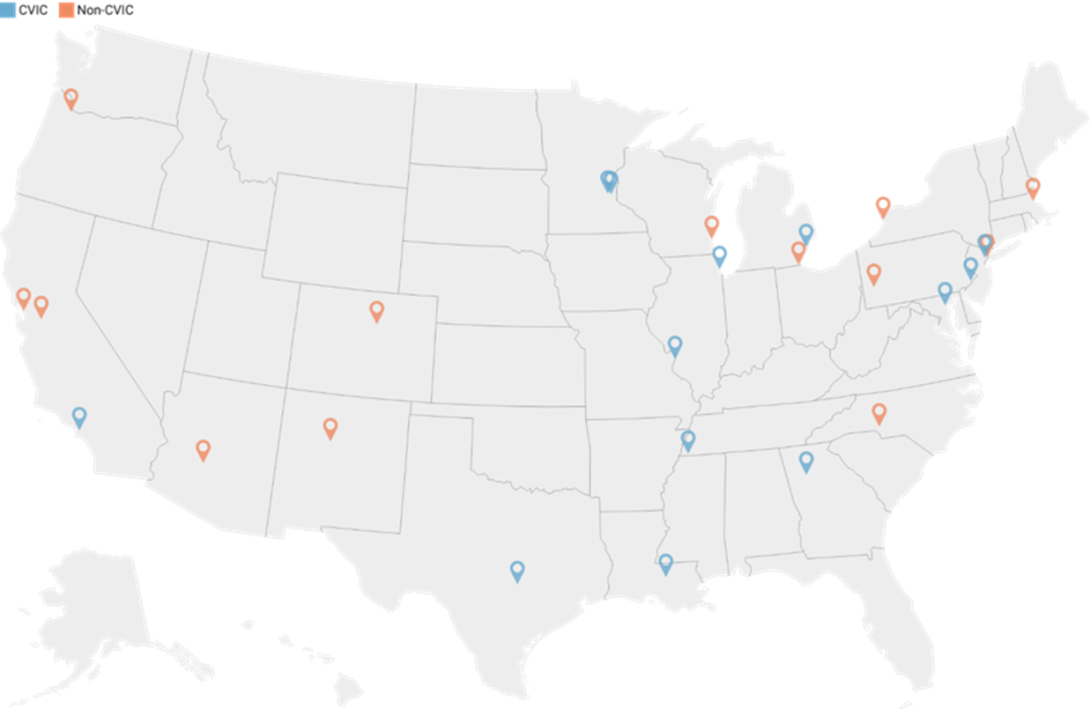
To get a more enhanced look at SLFRF spending, this post looks at 26 large, metropolitan cities that we are tracking as part of our ongoing research project on how cities use federal dollars to support CVIs. This includes 13 cities that are currently part of the White House Community Violence Intervention Collaborative, a cohort of jurisdictions committed to scaling “evidence-based community-led strategies to reduce gun violence and enhance public safety.” It also includes 13 pair cities with similar characteristics to those within the CVIC. The map above shows the 26 cities we are studying. In the map, the cities with a blue marker are in CVIC while cities with an orange one are not.
GVD Heading link
With a 2021 average of nearly 30 all-cause gun deaths per 100,000, the rate of gun violence in all our sample cities was far higher than in the US as a whole (which we calculated as 13.5).1 For that year, the prevalence of gun violence ranged widely among our 26 cities (see figure below).2
GVD image Heading link
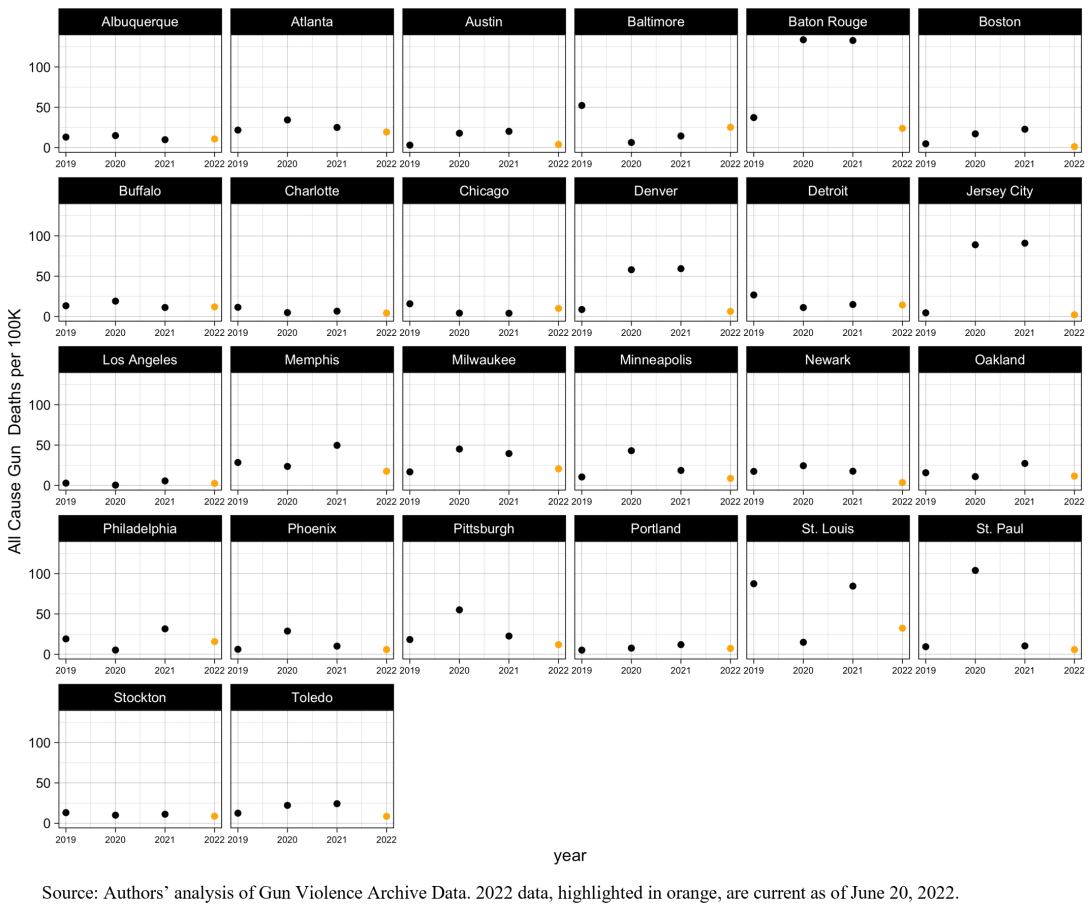
Where the level of gun violence is concerned, there was no statistically significant difference between CVIC and non-CVIC cities in 2021.3
SLFRF Spending Varied Widely Across Our Sample cities Heading link
SLFRF Spending Varied Widely Across Our Sample Cities
To what extent have the 26 cities in our sample obligated SLFRF dollars? As of December 31, 2021, these cities had obligated $1.3 billion of the over $5.5 billion dollars they received in the first tranche of distributed aid (total SLFRF aid is being distributed in two tranches). Our sample cities’ obligated 23% of their total available funds, slightly less than all 1,703 large cities and counties, which collectively obligated 33% of the available funds.
As the table below shows, the amount obligated varies significantly across our sample cities. At one extreme, Oakland, CA reported obligating 200% of its first tranche of aid, while Chicago, Philadelphia, and Toledo reported no obligations. Both Chicago and Toledo, however, had approved future spending plans. For example, Chicago’s City Council and Mayor approved SLFRF spending plans as part of the 2022 budget process, but Chicago’s fiscal year starts on January 1 so it hadn’t obligated any SLFRF dollars by the end of 2021. Only five cities (Albuquerque, Jersey City, Los Angeles, Memphis, and Oakland) obligated at least half of their first tranche of SLFRF aid.
| City | Total Obligations (as of 12/31/2021) | First Tranche of SLFRF Aid Transferred to Governments | Total Obligations as % of Available Funds |
|---|---|---|---|
| Albuquerque | $39,767,326 | $54,405,429 | 73% |
| Atlanta | $11,971,738 | $85,464,411 | 14% |
| Austin | $12,284,732 | $94,241,239 | 13% |
| Baltimore | $71,210,058 | $320,585,063 | 22% |
| Baton Rouge | $18,539,812 | $82,721,599 | 22% |
| Boston | $89,884,943 | $212,089,804 | 42% |
| Buffalo | $54,851,197 | $165,678,466 | 33% |
| Charlotte | $15,097,899 | $70,809,163 | 21% |
| Chicago | $0 | $943,295,694 | 0% |
| Denver | $37,687,053 | $154,024,435 | 24% |
| Detroit | $54,095,649 | $413,337,645 | 13% |
| Jersey City | $36,274,792 | $69,985,968 | 52% |
| Los Angeles | $347,365,185 | $639,450,464 | 54% |
| Memphis | $156,391,797 | $80,530,745 | 194% |
| Milwaukee | $8,500,762 | $197,113,325 | 4% |
| Minneapolis | $12,018,830 | $135,596,242 | 9% |
| Newark | $15,833,788 | $88,333,803 | 18% |
| Oakland | $188,081,700 | $94,040,850 | 200% |
| Philadelphia | $0 | $697,646,342 | 0% |
| Phoenix | $26,031,613 | $198,040,183 | 13% |
| Pittsburgh | $42,412,626 | $167,535,111 | 25% |
| Portland | $12,040,445 | $103,947,687 | 12% |
| St. Louis | $13,752,311 | $249,038,027 | 6% |
| St. Paul | $7,248,202 | $83,320,812 | 9% |
| Stockton | $11,370,653 | $39,026,036 | 29% |
| Toledo | $154,500 | $90,474,296 | 0% |
| Total | $1,282,867,609 | $5,530,732,835 | 23% |
| Median | $17,186,800 | $119,771,964 | 20% |
How Much Did Our Sample Cities Spend on Community Violence Interventions? Heading link
How Much Did Our Sample Cities Spend on Community Violence Interventions?
While we’re examining how cities are allocating their SLFRF dollars overall, our primary concern for our research project is whether, and how, cities are using the money for CVI programs. Our research focuses on this topic for several reasons. First, the need for alternatives to traditional policing came to the political forefront in 2020 following nationwide protests demanding racial justice that were sparked by recent police killings of Black Americans. Second, in a briefing on June 23, 2021, President Biden declared gun violence a public health crisis, one that had only worsened during the pandemic. That day, the Biden administration also rolled-out a comprehensive strategy to combat violence, which included encouraging governments to use SLFRF dollars to tackle gun violence. Moreover, the administration explicitly encouraged investment in CVI programs, and the SLFRF program complimented this push by permitting governments to use the aid for CVI. The Biden administration has also made additional federal funds available for CVI programs. In May 2022, President Biden repeated this call for governments to use SLFRF aid for “public safety and violence prevention.” The Biden administration, however, has not presented a uniform view on how cities should combat violence, and tactics mentioned range from hiring additional police officers to investing in mental health services. Hence, as part of our overall research agenda, we’ll examine whether or not the SLFRF program is reorienting public safety spending away from traditional forms of policing that center criminalization and incarceration and instead focusing it on community violence interventions that tackle root causes like poverty and systemic racism.
So how much SLFRF aid did our sample cities devote to CVI programs? One way to answer this question is to look at cities’ spending using the Treasury Department’s SLFRF expenditure categories. As we’ve previously written about, governments must report their spending to the Treasury Department at the project level and assign each project to one expenditure category. We also specifically looked at obligations. Obligations captures spending that has taken place, including expenditures and orders placed for property, services, contracts and/or subawards made (as well as similar transactions that require payment). Importantly, obligations differ from planned spending (also referred to as adopted budgets). While obligations account for spending that has already occurred, planned spending captures spending that will take place in the future.
For spending that took place between March and December 31, 2021, there were 67 expenditure categories (ECs), and category 3.16 was “Community Violence Intervention.” To determine how many SLFRF dollars went to CVI programs, we counted any obligations that were assigned EC 3.16 as CVI spending. It’s important to note that for this stage of analysis we did not scrutinize the projects cities assigned to EC 3.16, and spending in that category may be mislabeled as CVI (a future blog post will address this concern directly).
As a group, our sample cities obligated just 0.28% of the SLFRF aid they had available to spend on projects they labeled as CVI. That figure aligns with CVI obligations among the 1,703 cities and counties that reported spending to the Treasury Department for the March-December 31, 2021 period. In aggregate, local governments obligated just 0.12% of the $48.94 billion they had available to spend to CVI. The table below lists our 26 sample cities, whether they are in CVIC, and how much SLFRF aid they obligated to the CVI expenditure category.
| City | In CVIC? | Total CVI Obligations Reported | First Tranche Amount | CVI Obligations as % First Tranche |
|---|---|---|---|---|
| Albuquerque | N | $0 | $54,405,429 | 0.00% |
| Atlanta | Y | $0 | $85,464,411 | 0.00% |
| Austin | Y | $0 | $94,241,239 | 0.00% |
| Baltimore | Y | $7,279,058 | $320,585,063 | 2.27% |
| Baton Rouge | Y | $1,078,745 | $82,721,599 | 1.30% |
| Boston | N | $200,000 | $212,089,804 | 0.09% |
| Buffalo | N | $0 | $165,678,466 | 0.00% |
| Charlotte | N | $0 | $70,809,163 | 0.00% |
| Chicago | Y | $0 | $943,295,694 | 0.00% |
| Denver | N | $0 | $154,024,435 | 0.00% |
| Detroit | Y | $0 | $413,337,645 | 0.00% |
| Jersey City | N | $63,717 | $69,985,968 | 0.09% |
| Los Angeles | Y | $0 | $639,450,464 | 0.00% |
| Memphis | Y | $4,800,000 | $80,530,745 | 5.96% |
| Milwaukee | N | $0 | $197,113,325 | 0.00% |
| Minneapolis | Y | $2,318,647 | $135,596,242 | 1.71% |
| Newark | Y | $0 | $88,333,803 | 0.00% |
| Oakland | N | $0 | $94,040,850 | 0.00% |
| Philadelphia | Y | $0 | $697,646,342 | 0.00% |
| Phoenix | N | $0 | $198,040,183 | 0.00% |
| Pittsburgh | N | $0 | $167,535,111 | 0.00% |
| Portland | N | $0 | $103,947,687 | 0.00% |
| St. Louis | Y | $0 | $249,038,027 | 0.00% |
| St. Paul | Y | $0 | $83,320,812 | 0.00% |
| Stockton | N | $0 | $39,026,036 | 0.00% |
| Toledo | N | $0 | $90,474,296 | 0.00% |
| Total | $15,740,167 | $5,530,732,835 | 0.28% |
As the above table highlights, only six of our 26 sample cities devoted any SLFRF aid specifically to the CVI expenditure category. Moreover, of the 13 cities that are part of CVIC, only four obligated SLFRF dollars to the CVI expenditure category as of December 31, 2021. And, as noted above, the figures shown in the above table may be the most generous view because we have not yet evaluated whether the projects assigned the CVI expenditure category are indeed CVI programs. We also have not evaluated whether some projects that are CVI that governments assigned to different expenditure categories.
While our sample cities devoted few SLFRF dollars to CVI by the end of 2021 we expect to see more spending on these programs in the future. This is because cities reported adopted budgets to the Treasury Department, and 10 of our sample cities reported they plan to spend SLFRF aid on CVI projects. For example, while Chicago reported it had not obligated any SLFRF dollars by the end of 2021, the city also reported that it plans to spend $105 million (or about 6% of its total SLFRF allocation) on projects it assigned to the CVI expenditure category. It is also worth noting that our approach here does not capture the indirect effects of SLFRF, which could have freed up other revenue sources for cities to use on CVIs. We will address this issue in a future blog post.
How Did Our Sample Cities Allocate Their SLFRF Dollars? Heading link
How Did Our Sample Cities Allocate Their SLFRF Dollars?
Like other local governments around the country, cities in our sample have obligated the largest aggregate share of their dollars to revenue replacement as opposed to specific, new projects.
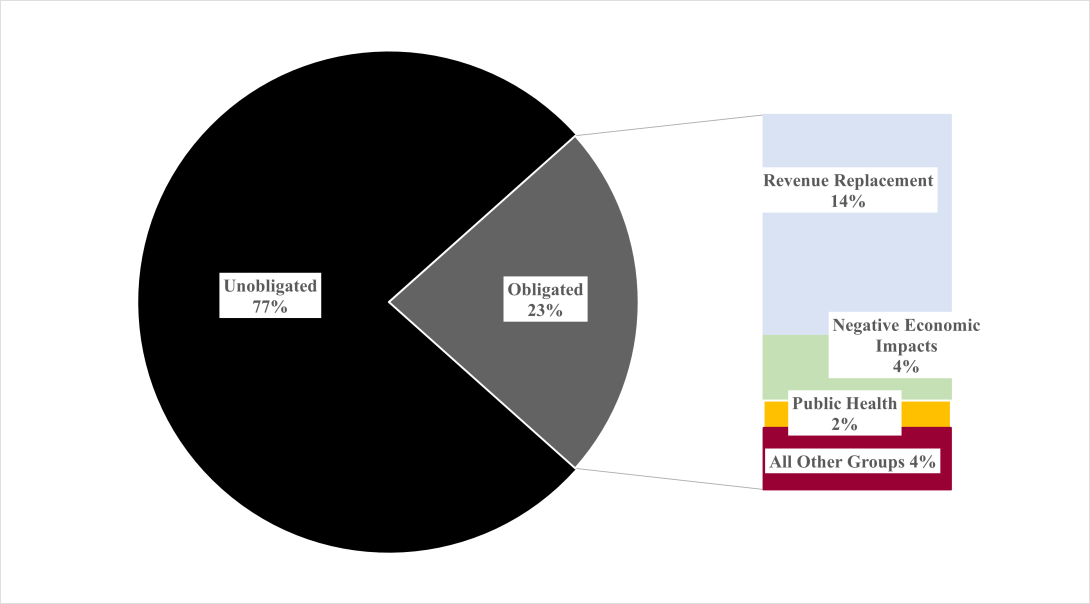
Of the $1.3 billion that our 26 sample cities had obligated as of December 31, 2021, 59.02% was directed towards revenue replacement. The spending trends among our sample cities, however, are skewed by a handful of places. Just three cities (Los Angeles, Memphis, and Oakland) account for 54% of the total $1.3 billion in obligations. Los Angeles and Oakland both devoted the vast majority of their SLFRF aid to revenue replacement. Oakland is an especially noteworthy outlier among our 26 cities because it reported that it obligated all of its SLFRF aid to the Treasury Department, and it plans to use all of its aid on revenue replacement.
In context of the total amount of money our sample cities had available to spend, revenue replacement accounted for 13.69% of our cities’ total first tranche of SLFRF aid. The pie chart highlights this by comparing our sample cities obligated versus unobligated funds, and then breaking the obligated funds down by several spending categories.
the key take away Heading link
The key takeaway is that while the majority of obligated SLFRF dollars went to revenue replacement, as a group, our sample cities spent a small amount of the SLFRF money they had available to spend by the end of 2021.
It is still too early to make definitive conclusions about the SLFRF program at this stage for three reasons. First, Treasury did not finalize program rules until April of this year. Some governments were hesitant to spend SLFRF dollars before rules were finalized. Second, the data available thus far only covers spending that took place between March and December 31, 2021. Third, governments have until the end of 2024 to obligate the funds, so we expect spending trends to unfold over the next few years.
Further, as the data here suggest, drawing conclusions about how the program is working in general may be difficult. The SLFRF program was designed to be flexible enough to meet the highly variable needs of governments across the country. Because of this, understanding and assessing the program’s outcomes will require both analysis of national datasets and a granular approach to contextualizing spending decisions within local political dynamics, policy priorities, and pre-COVID fiscal conditions.
Endnotes Heading link
Endnotes
1 To avoid some of the problems posed by federal statistics, these figures are based on all-cause gun violence figures obtained via Gun Violence Archive. More information on the Archive’s methodology can be found here: https://www.gunviolencearchive.org/methodology.
2 2022 data, highlighted in orange, are current as of June 20, 2022.
3 t = -0.5132, df = 20.724, p-value = 0.6132